|
Today was the final day of my independent study, and it was very productive! I finished writing up my analysis of study drugs and posted it on medium. The post can be found here.
One choice I made was to write the study drug writeup in a slightly more formal register. I'm dealing with statistics, so it's important to use precise language to avoid miscommunication. This style of writing naturally entails slightly more formal language. However, I don't think it impeded the comprehensibility of my article too much, especially because I have lots of clear charts amongst the text. I think the article may have ended up being more confusing if I tried too hard to maintain the informal register I've used for the other articles, because I may have had to say some ambiguous things about the data that I analyzed. I also wrote my final article today! This article can be found here. Its title is "An Overlooked Superpower: How to Explain Complex Concepts," and I discuss many of the things I've discovered throughout these three weeks. I summarize my discoveries in 5 tips: 1. Convince your audience that they're capable of understanding your topic. 2. Build a strong foundation before moving up. 3. Include drawings for technical concepts. 4. Build a narrative, if appropriate. 5. Use easily understandable language. To explore each of these tips, I dove into different ways to apply each of these tips in writing and the effects that these tips are meant to have on the readers. I also included a bit of indirect analysis of my own writing, such as my use of narrative to clarify the mechanics of cryptocurrency in my first article. I also make the point that learning to explain things clearly is one of the most powerful things anyone can learn to do. A clear explanation basically results in putting part of the structure of your brain inside another person's brain. When you think about it, this is a magnificent thing to be able to do! At this point, I have 5 articles and around 20,000 thoughtful words posted on Medium. I've gotten invited to publish two of my articles, and I've learned a ton about a variety of technical concepts. I feel that I've grown significantly as a writer during this 3 week period. I've even noticed that I've had a noticeably easier time explaining technical concepts to people in person. All of the articles that I've written can be found here. Overall, I think this has been a valuable and successful independent study!
0 Comments
When I opened up medium.com today, I was greeted with another exciting surprise!  This is even more exciting to me than my previous invitation by Analytics Vidhya! Towards Data Science is the biggest data science related Medium publication around, and I've regularly read their content for years as I've learned data science. I'm very excited to have my writing potentially exposed to hundreds of people all over the world, and I'll make sure to edit my post carefully before submitting it for publication to Towards Data Science. In addition, I performed all my analysis of the drug use data today. I decided to ask 6 main questions of the data:
This pie chart represents that percentage of stimulant users who used a "study drug", methamphetamine, or both in the past year: 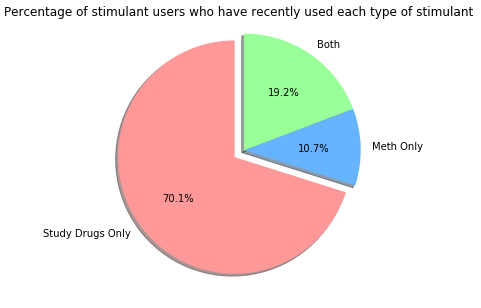 It's interesting that people who have recently used only study drugs are by far the largest group of the subset of stimulant users. This could be due to several things. Firstly, "study drugs" are drugs that are often prescribed to treat conditions such as ADHD, so most people know at least one other person who is in possession of these drugs. Secondly, illegal possession of these drugs is less strictly enforced than possession of methamphetamine, and penalties for possessing study drugs are generally far more lenient. Finally, study drugs are generally less dangerous than methamphetamine (though they're still dangerous if misused), which lowers the barrier to entry that college students face when using them for the first time. There are likely a variety of other factors that explain this trend, but these are the primary ones that my research has led me to.
Tomorrow I'll compile many more analyses like this one that I've already done into a single post. Today, I finished my credit risk modeling article! I've posted it on Medium here. As I've written each technical article, I've noticed that the process of explaining complex topics has become slightly easier, almost like I'm training a muscle in my brain whose focus is clear explanation. With an article on cryptocurrency, an article on neural networks, and an article on credit risk modeling with machine learning, I feel that I've produced a nice set of high-quality learning resources related to topics that I love. Today, I spent most of my day diving into a dataset I found on illicit drug use throughout the US! My next article will be slightly different from my previous articles. While my previous three articles were long-winded explanations of complex technical topics, this article will be a compact statistical analysis, making use of plenty of charts. My goal in performing this analysis is to investigate trends in the use of non-methamphetamine stimulants, such as Adderall and Ritalin. These stimulants have acquired a reputation for being commonly used by college students while the students study for exams, and I'd like to investigate this phenomenon more closely and communicate my results.  I spent much of today exploring the contents of the dataset and getting a feel for the types of questions I'll ask of the data. I found the data here, and it's available for anyone to freely use for educational purposes. This is the biggest dataset I've ever worked with; it has almost 70,000 rows and over 3,000 columns. Fortunately, I have significant experience using Python and a variety of libraries for python to manipulate large datasets, so exploring this data was the perfect opportunity for me to practice these skills and prepare to utilize them to make this huge dataset understandable. I'm generating all graphs that I'll use in my article on my own using Python. Tomorrow, I'll do all of my analysis and generate all the graphs that I'll use in my article!
Today I got a very exciting surprise! When I logged into medium.com to make minor tweaks to my neural networks article, I saw a note next to my article.  I read Analytics Vidhya's publication all the time, and I've learned a ton from it. Analytics Vidhya is actually one of the top data science publications on medium. You won't be surprised to hear that I was absolutely delighted! I emailed her back and said I would be honored if she featured my article, and I sincerely hope that many people end up enjoying it.
In addition, I spent much of my day writing my article on credit risk modeling. I began the article by discussing the basics of credit risk modeling, explaining how the Law of Large Numbers relates to the need to calibrate interest rates. Then, I moved onto the statistical transformations I applied to the data before feeding it into the models I made. I explained two important transformations: converting categorical variables to dummy variables, and normalizing continuous variables. Then, I went through the four machine learning models I used, explaining the basics of each model and how it applies to credit risk modeling specifically. One neat part about this article is that it's a good outline of the process of any machine learning project. Credit risk modeling is a great topic to introduce readers to the utility of machine learning, but once readers understand this article, they'll have an easier time picking up the workflow of machine learning in many other industries, such as logistics, healthcare, and even natural sciences like thermal physics. I'm learning a lot writing this article, too. Synthesizing resources to create a detailed explanation of a complex phenomenon truly is one of the best ways to solidify one's own understanding. I have a pretty good idea of how my schedule for the rest of this intensive will look. I didn't finish the article today, so I'll finish it up this weekend. On Monday, Tuesday, and Wednesday, I'll research and write my analysis of national adderall use, and I'll also edit my previous articles. Finally, on Thursday, I'll write my article that will serve as a tutorial on distilling complex topics, and I'll also create my intensive fair presentation video. Today, I created a simple credit modeling system using Python. The system uses a publicly available dataset from UC Irvine, and its goal is to predict the probability that users will default on loans. In a real risk modeling system, this statistic is essential, because it allows a lender to calibrate interest rates to make it highly likely that they will achieve a profit. I saw my activities today as a form of "active research" – that is, learning by doing. I tried out several different algorithms to analyze the data, and all of these algorithms are commonly used in the risk modeling industry. The first algorithm I tried is called K-nearest neighbors, and it works by calculating the similarity between columns based on their multi-dimensional euclidian distance from one another. The second algorithm I tried it called logistic regression, which is a probabilistic version of the commonly used linear regression algorithm. Crucially, K-nearest neighbors does not return probabilistic results by default, while logistic regression does. I also tried using random forests of decision trees. Random forests involve creating multiple different decision tree models, and assembling these trees into a "forest" to analyze the trees' answers as a whole. Finally, I tried a neural network that resembles the one I wrote about in my last article. 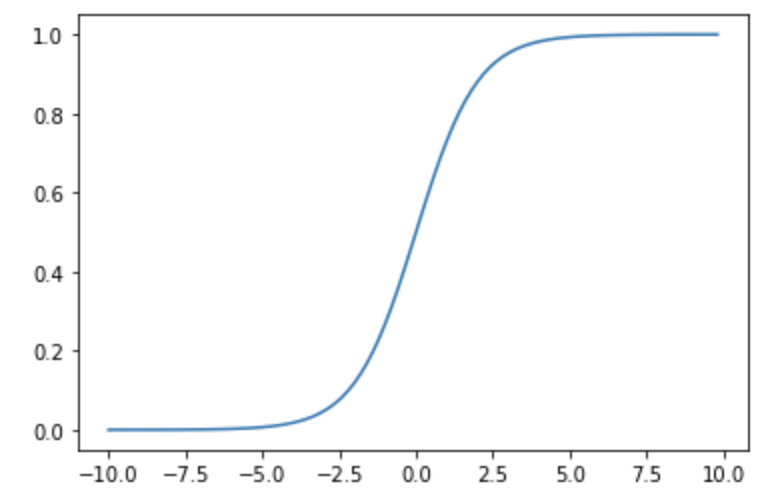 A curve that resembles the logistic regression curve I know, that paragraph above sounds absurdly complicated! That's just the distilled version of what I worked on today. The actual article will explain all these terms clearly and be much easier to understand!
Working on a credit risk model myself taught me several things that will be important for me to keep in mind as I write my article. Before I put the data into the models, I realized I had to make several relatively simple, but very important statistical adjustments to the data so that the models could process it. Without making these adjustments, the models crashed. Understanding these adjustments is vital to understanding modern risk modeling, and statistics in general, so I'll be sure to explain these adjustments clearly in my post. Tomorrow, I'll start writing my article! I don't expect to finish it tomorrow, so I'll finish it over the weekend. Today I focused on doing research on the process of credit risk modeling. Whenever a bank or a person gives somebody a loan, the loaning party, or the creditor, attaches an interest rate to the loan. This interest rate serves two purposes. Firstly, the interest rate makes some profit for the creditor, which incentivizes the creditor to loan their money in the first place. In addition, however, the interest rate makes up for the small percentage of people who don't pay back their loans. Not being able to pay back a loan is called defaulting on the loan. Interest rates are calibrated so that people whose default risk are greatest have to pay the greatest interest rates. Ideally, interest rates should be calibrated such that the creditor never ends up losing money, no matter what percentage of people they loan money to are highly risky. If everyone a creditor loaned money to had a high default risk, people would often default on loans, but the high interest rate the risky people who don't default on their loans would have to pay makes up for the high default rate in the creditor's eyes. On the other hand, if a creditor only loaned money to people with a low default risk, the creditor wouldn't get much money in interest rates, but they wouldn't lose much money either due to people defaulting.
The process of modeling somebody's credit risk in order to set their interest rate appropriately is vital! The goal in credit risk modeling is to be able to estimate the chance as accurately as possible that a lenders will end up defaulting. If this chance is known, then interest rates can be calibrated so that the creditor never ends up losing money. If the creditor can do this effectively, then the relationship between the creditor and the lenders is similar to the relationship between the house and the patrons at a casino. Just as casinos use probability to calibrate games so that the casino always comes out ahead in the end, creditors can calibrate interest rates so that the creditors always come out ahead as well. If done effectively, lending money can be a highly profitable business to get into. With so much money at stake, it's only natural to expect that the most powerful tools available would be used to estimate default risk. In fact, a tool that I just wrote about is often used: neural networks! Powerful neural networks and machine learning algorithms are often used in credit risk modeling to analyze massive datasets about lenders, using past data to predict future default risks. To better understand this process, I've begun creating my own miniature credit modeling data analysis system. I'll keep working on it tomorrow, and I'll begin writing my article about how the whole process works tomorrow as well. Even after just a bit of work on the system, I already feel like I understand how credit risk modeling works much more thoroughly than I did several days ago. I find that learning by doing is excellent preparation for writing explanatory articles like these. I finished my draft of my article on neural networks today! This was definitely a more challenging article to write than my cryptocurrency article, but I learned a tremendous amount from writing it. The biggest challenge I faced in writing this article was presenting all the mathematical concepts in such a way that readers don't need any background in linear algebra or calculus to understand it. Some people might think that they key to presenting these mathematical concepts accessibly would be to simplify them, but I disagree. I think it's very important to preserve nuance and technical accuracy. The key, I think, to making these concepts accessible is to present them in a very intuitive fashion, using lots of pictures and normal sounding words instead of equations and jargon. For example, I talk about a concept called "minimizing the loss function," which involves trying to find the lowest point on a multi-dimensional curve. Behind the scenes, the neural network uses high-dimensional multivariable calculus to make these calculations. However, I obviously can't delve into high-dimensional multivariable calculus in my article. Instead, I take this concept and explain it in just two dimensions using the ideas behind calculus, but no calculus. I start by showing the graph below, saying that our goal is to get to the lowest point on it. 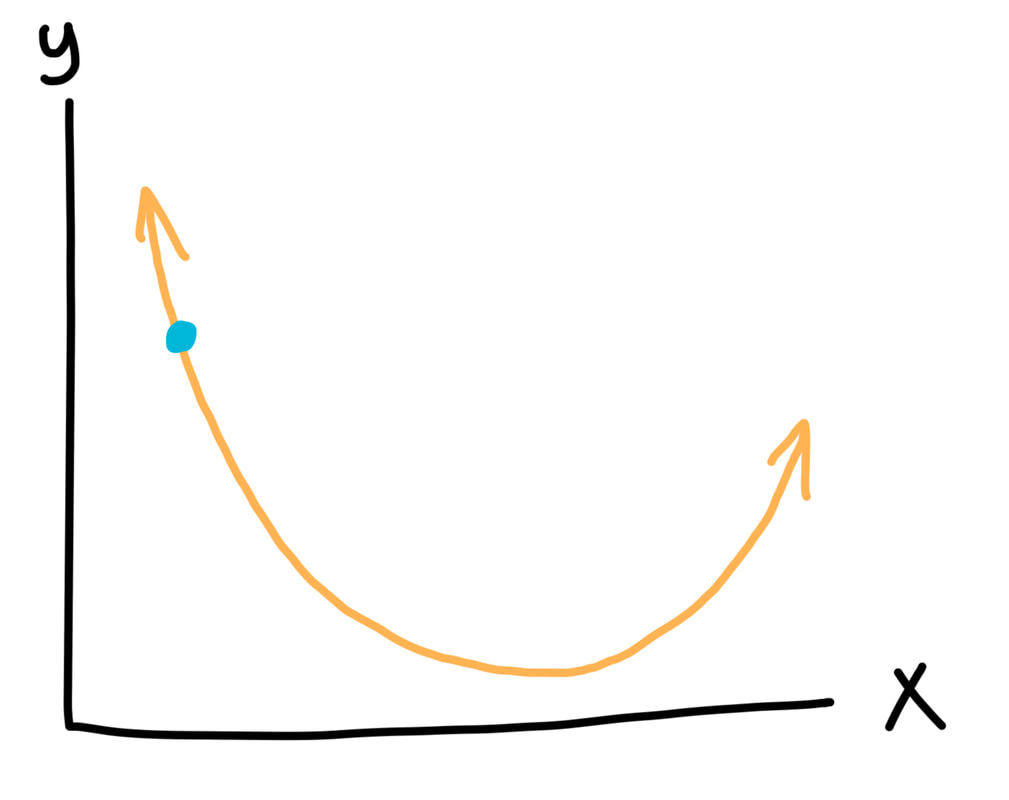 But then I mention there's a catch: we're only allowed to look at the part of the graph that's near us, so we can't actually see the lowest point. We can only tell whether the graph is going up or down at the point we're standing at. This is all we see:  If we're just trying to go down, though, this is no problem! All we have to do is take a jump towards the right, the direction in which the graph is pointing down. If we keep doing this, we'll find our way to the bottom of the curve.
The actual calculus concept that this represents is the derivative, which is a way of calculating the slope of a line at a single point. The neural network calculates the derivative of the function at a specific point, then uses the derivative's value to decide which way to move the point. However, visualizing the process with the 2D graph instead is much easier for somebody who's learning about this concept for the first time, and this is still a mathematically appropriate model for a 2D system. This is a simple example, but I tried to fill the whole neural networks article with nuanced but accessible explanations of complex topics such as this one. Now I've begun working on my article about credit risk modeling! I've already done a bit of research on the topic, and tomorrow, I'll build my own credit risk modeling system so that I can learn by doing. |
Jeremy MahoneyImpromptu teacher, lover of learning, and admirer of the universe ArchivesCategories |
 RSS Feed
